 |
| Deb Roy: The birth of a word |
- 90,000 hours video
- 140,000 hours multi-track audio
- a 70-million-word transcript
Considering this exercise of imagination, what would you do to harvest usable information out of that huge amount of opaque data? Here is where MIT cognitive scientist Deb Roy found his challenge: gathering and using such a natural longitudinal data to understand the process of how a child (his son) learns language. He described his research on this Big Data at MIT during his TED talk this month:
But it's not easy to strip all the developmental milestones — from one's first steps as a baby to the mastery of any spoken word (e.g., water) — from what is by far "the largest home video collection ever made". Then how about rolling back to see what verbal and physical interactions preceded the acquisition of language during early childhood?
I think this is where the visualization of data comes into play to communicate the message. For instance, Deb Roy's team reaped the power of data and captured every time his son ever heard the word water along with the the context he saw it in. They then used this data to penetrate through the video, find every activity trace that co-occurred with an instance of "water" and map it on a blueprint of the apartment. That's how they came up with wordscapes: the landscape that data leaves in its wake.
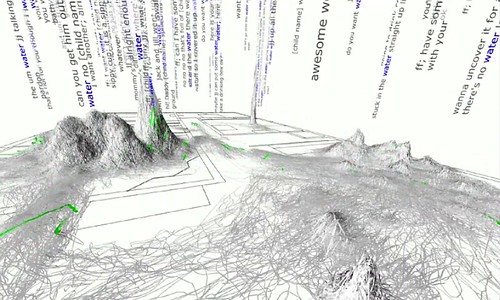 |
| Wordscape for the word water – most of the action takes place in the kitchen. |
Two years ago, during a research assignment at my University, I was getting a first contact with Apache Hadoop — a software framework that supports data-intensive distributed applications. Today, Deb Roy's TED talk inspired me to look for what solutions are available today for doing analytics on Big Data and transform them into information, but considering all the challenges that we meet when rising to the enterprise level. An interesting answer to this challenge can be found in InfoSphere BigInsights, which aims to bring Apache Hadoop MapReduce large scale analytics to the enterprise.
More examples of how to make intelligent use of Big Data can be found in TechCrunch's interview with Anjul Bhambhri, VP responsible for Big Data at IBM. In this interview, several interesting projects are mentioned, such as:
- detecting an onset of infection in critically premature infants;
- solving congestion problems in big cities like Stockholm as part of the IBM Smarter Planet initiative;
- and of course about Watson and how it outsmarted humans on Jeopardy and how this technology helps real business.
Anjul Bhambhri interviewed by TechCrunch |
Now consider that you can garner the power of Big Data and create meaningful visualizations that bring information to life: what dataset would motivate your work, what problem would you solve first?
Photo credit: Steve Jurvetson
No comments:
Post a Comment